8 August, 2025

Author
Kyrylo Kozak
Agency Operations: Systems That Scale
At $15K per month, running an agency felt manageable. I could track everything in my head, quality was consistently high, and clients were happy.
At $100K per month, everything was on fire. Projects were falling through cracks, team members were confused about responsibilities, and I was working 80-hour weeks just to keep things from completely imploding.
The painful realization: What got us to $100K would kill us before $200K.
After nearly losing our biggest client due to operational chaos, we rebuilt everything from scratch. Today, those systems power our $350K monthly operation with half the stress. Here's the complete blueprint.
The Operational Breaking Points
Every growing agency hits these walls:
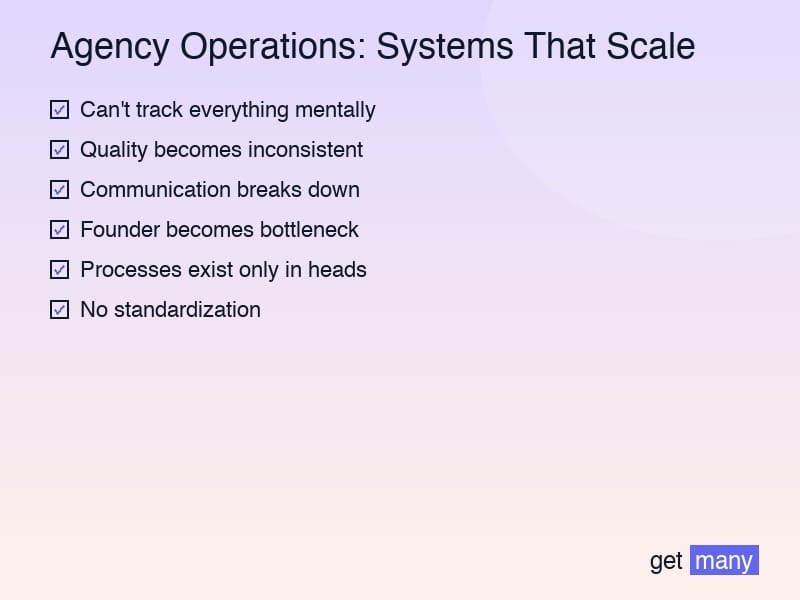
The $50K Wall:
- Can't track everything mentally
- Quality becomes inconsistent
- Communication breaks down
- Founder becomes bottleneck
The $100K Wall:
- Processes exist only in heads
- No standardization
- Accountability unclear
- Fires everywhere
The $200K Wall:
- Middle management needed
- Systems must be bulletproof
- Culture dilution risk
- Complexity overwhelming
Without systems, each wall becomes a ceiling.
System 1: The Project Management Machine
The Three-Layer Project Architecture
Layer 1: Strategic Overview (Monday.com)
- All active projects visible
- Resource allocation clear
- Timeline dependencies mapped
- Budget tracking live
- Risk indicators flagged
Layer 2: Tactical Execution (Notion)
- Detailed project wikis
- Task breakdowns
- Team assignments
- Document storage
- Communication logs
Layer 3: Daily Operations (Slack + Integrations)
- Real-time updates
- Quick decisions
- Blocker resolution
- Team coordination
- Client communication
The Project Lifecycle Framework
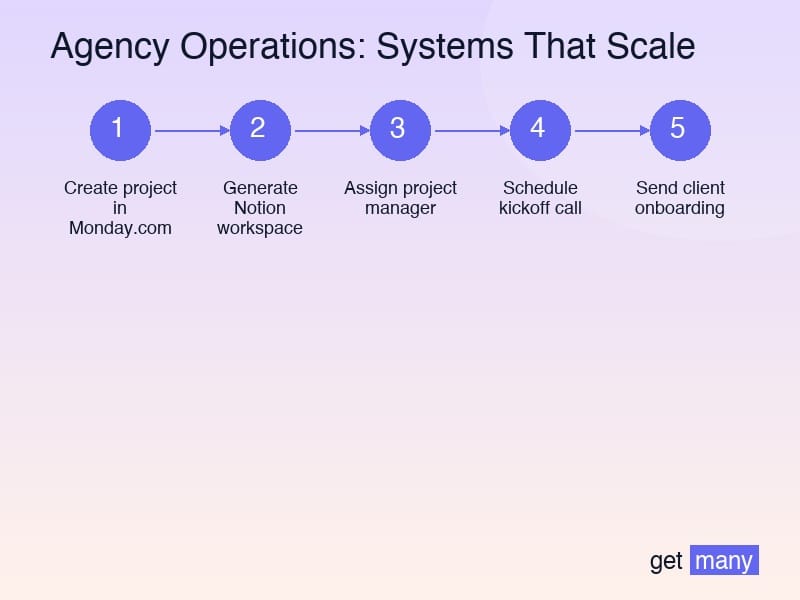
Phase 1: Intake (Automated) ``` Trigger: New project won Actions:
- Create project in Monday.com
- Generate Notion workspace
- Assign project manager
- Schedule kickoff call
- Send client onboarding
Time: 15 minutes (was 2 hours) ```
Phase 2: Planning (Templatized)
- Scope documentation template
- Resource allocation matrix
- Timeline generator
- Risk assessment checklist
- Communication plan template
Phase 3: Execution (Systematized)
- Daily standup automation
- Weekly client update templates
- Milestone review process
- Quality checkpoints
- Issue escalation paths
Phase 4: Delivery (Standardized)
- Completion checklist
- Client handoff process
- Feedback collection
- Team retrospective
- Knowledge capture
The Status Dashboard
Real-time visibility into everything:
Project Health Indicators:
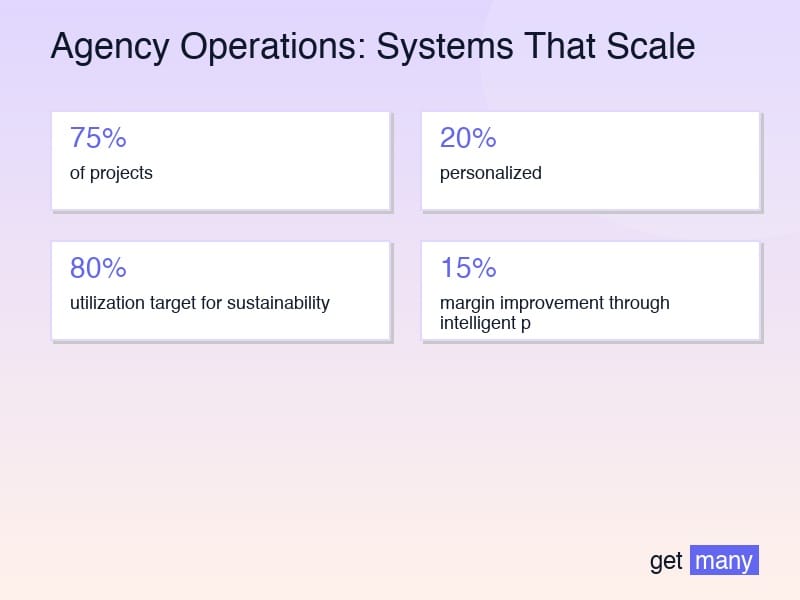
- 🟢 Green: On track (75% of projects)
- 🟡 Yellow: Attention needed (20%)
- 🔴 Red: Immediate action (5%)
Automatic Alerts:
- Timeline slippage >10%
- Budget overrun risk
- Quality issues flagged
- Client communication gaps
- Resource conflicts
System 2: The Quality Assurance Framework
The Four-Gate Quality System
Gate 1: Peer Review
- Every deliverable reviewed
- Checklist-driven process
- 24-hour turnaround
- Feedback documented
- Learning captured
Gate 2: Technical QA
- Automated testing where possible
- Manual testing protocols
- Performance benchmarks
- Security scanning
- Accessibility checks
Gate 3: Senior Review
- Strategic alignment check
- Client expectation match
- Brand consistency
- Innovation opportunities
- Risk assessment
Gate 4: Client Preview
- Internal demo first
- Feedback incorporation
- Polish application
- Documentation prep
- Delivery rehearsal
The Quality Metrics Dashboard
Track What Matters:
- First-time acceptance rate: Target 95%
- Revision requests: Target <5%
- Critical bugs shipped: Target 0
- Client satisfaction: Target 9+/10
- Team pride score: Target 90%
The Magic: Quality becomes predictable, not accidental.
System 3: The Communication Protocol
Internal Communication Architecture
The RACI Matrix for Everything:
- Responsible: Who does the work
- Accountable: Who owns the outcome
- Consulted: Who provides input
- Informed: Who needs updates
Communication Channels: ``` Urgent + Important: Phone call Urgent + Not Important: Slack DM Not Urgent + Important: Notion comment Not Urgent + Not Important: Don't communicate ```
Client Communication System
The Weekly Rhythm:
Monday: Week Preview
- What we're working on
- Expected deliverables
- Any blockers
- Decisions needed
Wednesday: Progress Pulse
- Quick status update
- Any changes
- Wins to celebrate
Friday: Week Wrap
- What we accomplished
- Next week preview
- Any concerns
- Appreciation note
Automation Level: 80% templated, 20% personalized
The Documentation Standard
Everything Gets Documented:
- Meeting notes: Notion within 2 hours
- Decisions: Logged with rationale
- Processes: Video + written
- Learnings: Retrospective captures
- Knowledge: Searchable wiki
Result: New team members productive in days, not weeks.
System 4: The Resource Management Engine
The Capacity Planning Model
The Formula: ``` Available Hours = (Team Members × 40 hours) × 0.8 (80% utilization target for sustainability)
Committed Hours = Sum of all project allocations
Buffer Required = 20% for emergencies ```
Visual Management:
- Green: Under 70% utilized
- Yellow: 70-85% utilized
- Red: Over 85% utilized
The Skill Matrix System
Track Team Capabilities:
| Team Member | React | Node | Python | AWS | Design | |------------|-------|------|---------|-----|---------| | Alice | Expert | Advanced | Basic | Advanced | None | | Bob | Advanced | Expert | Advanced | Basic | Basic | | Carol | Basic | Basic | Expert | Expert | None |
Benefits:
- Resource allocation optimized
- Training needs identified
- Hiring gaps clear
- Cross-training planned
- Single points of failure eliminated
The Bench Management Strategy
Always Maintain 20% Bench Strength:
- Overflow contractors identified
- Relationships maintained
- Skills pre-vetted
- Rates negotiated
- Onboarding streamlined
When demand spikes, scale instantly.
System 5: The Financial Control Center
The Real-Time P&L Dashboard
Track Per Project:
- Revenue recognized
- Hours invested
- Direct costs
- Gross margin
- Net profitability
Track Per Client:
- Lifetime value
- Monthly recurring
- Growth trajectory
- Profitability trend
- Payment history
Track Per Service:
- Demand patterns
- Margin analysis
- Resource requirements
- Growth potential
- Investment priority
The Cash Flow Prediction System
13-Week Rolling Forecast:
- Confirmed revenue
- Probable revenue (70% weight)
- Possible revenue (30% weight)
- Fixed costs
- Variable costs
- Investment plans
Automated Alerts:
- Cash below 2 months runway
- Large payment delays
- Unusual expense patterns
- Budget overruns
- Opportunity costs
The Pricing Intelligence Framework
Dynamic Pricing Based On:
- Current utilization
- Market demand
- Client history
- Project complexity
- Strategic value
Result: 15% margin improvement through intelligent pricing
System 6: The Knowledge Management Ecosystem
The Learning Capture System
After Every Project:
- What went well?
- What could improve?
- What did we learn?
- What should we systematize?
- Who else needs to know?
Storage Structure: ``` /Knowledge Base /Client Learnings /Industry Insights /Technical Solutions /Process Improvements /Tool Discoveries /Team Wins /Failure Lessons ```
The Standard Operating Procedures
SOP for Everything Repeated 3+ Times:
Example SOP Structure:
- Purpose and scope
- Step-by-step process
- Decision trees
- Common issues
- Quality checklist
- Related resources
Current SOP Library:
- 147 documented processes
- 89 video walkthroughs
- 234 template documents
- 45 automation scripts
Time Saved: 40 hours/week across team
System 7: The Continuous Improvement Machine
The Weekly Retrospective Ritual
Every Friday, 60 Minutes:
- Wins worth celebrating
- Challenges faced
- Process improvements
- System updates needed
- Action items assigned
Participation: Mandatory for all
The Monthly Operational Review
Deep Dive Analysis:
- System performance metrics
- Process efficiency scores
- Team feedback themes
- Client satisfaction trends
- Innovation opportunities
Output: 3-5 improvement initiatives
The Quarterly Revolution
Every 90 Days:
- Challenge every process
- Question every system
- Eliminate complexity
- Automate repetition
- Simplify everything
Goal: 10% efficiency gain quarterly
The Implementation Roadmap
Phase 1: Foundation (Month 1)
- Choose project management tool
- Document first 10 processes
- Implement daily standups
- Create first dashboards
- Set communication protocols
Phase 2: Expansion (Month 2-3)
- Add quality gates
- Build resource planning
- Implement financial tracking
- Create knowledge base
- Train team thoroughly
Phase 3: Optimization (Month 4-6)
- Automate repetitive tasks
- Refine based on data
- Eliminate bottlenecks
- Scale successful patterns
- Measure everything
The Technology Stack That Powers It All
Core Operations:
- Monday.com: Project management
- Notion: Knowledge management
- Slack: Communication hub
- Zapier: Automation engine
- QuickBooks: Financial management
Supporting Tools:
- Loom: Process documentation
- Calendly: Scheduling automation
- Toggl: Time tracking
- Figma: Design collaboration
- GitHub: Code management
Analytics Layer:
- Databox: KPI dashboards
- Google Analytics: Performance tracking
- Hotjar: User insights
- Mixpanel: Product analytics
Monthly Investment: $1,200 Monthly Time Saved: 400 hours ROI: 3,233%
Common Scaling Mistakes to Avoid
Mistake 1: Perfecting Before Implementing
Start with 70% perfect and iterate. Perfect systems launched never beat good systems improved daily.
Mistake 2: Over-Systematizing
Not everything needs a system. Keep humanity in human interactions.
Mistake 3: Ignoring Team Feedback
The people using systems daily know what's broken. Listen actively.
Mistake 4: Complexity Creep
Every system tends toward complexity. Fight for simplicity constantly.
Mistake 5: Set and Forget
Systems need maintenance. Schedule regular reviews or watch them decay.
The Transformation Timeline
Month 1: Chaos reduction begins Month 3: Team confidence growing Month 6: Predictability achieved Month 9: Scale unlocked Month 12: New normal established
But the real magic? You stop fighting fires and start building the future.
Your 30-Day Quick Start
Week 1: Assessment
- Document current chaos points
- Survey team pain points
- Analyze time wasters
- Identify quick wins
- Set implementation priorities
Week 2: Foundation
- Choose 3 core tools
- Document 5 key processes
- Create first dashboard
- Train team basics
- Celebrate early wins
Week 3: Implementation
- Roll out gradually
- Gather feedback daily
- Iterate rapidly
- Fix issues immediately
- Build momentum
Week 4: Optimization
- Measure impact
- Refine approaches
- Plan next phase
- Document learnings
- Prepare to scale
The Mindset of Operational Excellence
Systems aren't about control - they're about freedom.
Freedom to focus on strategy instead of firefighting. Freedom to take vacations without fear. Freedom to scale without breaking.
The agencies stuck at $50K are drowning in chaos. The agencies scaling past $500K are powered by systems.
Your Next Actions
- Identify your biggest operational pain point right now
- Choose one system from this guide to implement
- Document the current process (however broken)
- Design the improved version with your team
- Implement this week and iterate based on results
The difference between agencies that scale and those that stall isn't talent, luck, or market conditions.
It's systems.
Every day you operate without proper systems, you're choosing chaos over growth, stress over scale, burnout over breakthrough.
Stop letting operations be your ceiling. Start building systems that scale.
Your future agency - calm, profitable, scalable - is waiting on the other side of systematic thinking.
The time to systematize isn't when you need it. It's before you're desperate.
Start today.


